#wannabeeeeeee the best DataScientist
K-NN + Python_Code 본문
728x90
◎ K-Nearest Neighbors
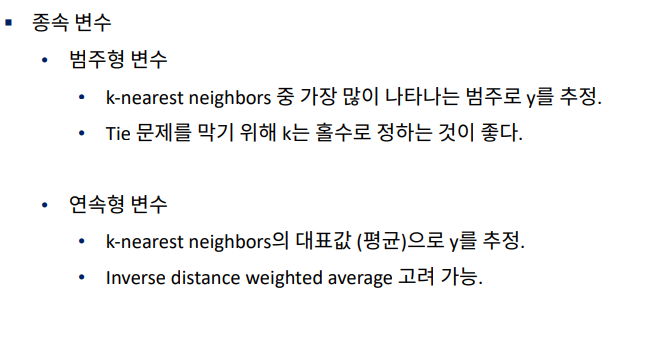
- K-최근접 이웃(K-Nearest Neighbor, KNN)은 지도 학습 알고리즘 중 하나입니다.
- 데이터가 주어지면 그 주변(이웃)의 데이터를 살펴본 뒤 더 많은 데이터가 포함되어 있는 범주로 분류하는 방식입니다.


◎ 수학적 개념 이해
ⓐ Cross-validation : 과적합, sample loss를 해결하기 위해 사용
- k-fold cross validation


※ Test error : 데이터에 따라 최적의 k가 존재

k-Nearest Neighborhood Algorithm 실습
1. 데이터, 모듈 불러오기 및 kNN 피팅 방법
- 함수 불러오기
In [1]:
from sklearn import neighbors, datasets
In [2]:
import numpy as np
import matplotlib.pyplot as plt
from matplotlib.colors import ListedColormap
In [3]:
iris = datasets.load_iris()

X = iris.data[:, :2]
y = iris.target
- 모델 구축
In [4]:
clf = neighbors.KNeighborsClassifier(5)
clf.fit(X,y)
Out[4]:
KNeighborsClassifier()In [5]:
y_pred=clf.predict(X)
In [6]:
from sklearn.metrics import confusion_matrix
In [7]:
confusion_matrix(y,y_pred)
Out[7]:
array([[49,  1,  0],
       [ 0, 38, 12],
       [ 0, 12, 38]], dtype=int64)
2.Cross-validation을 활용한 최적의 k찾기
- 함수 불러오기
- "from sklearn.cross_validation import cross_val_score" 코드가 아래와 같이 변경되었습니다.
In [8]:
from sklearn.model_selection import cross_val_score
- CV 진행
In [9]:
k_range= range(1,100)
k_scores=[]
for k in k_range:
    knn=neighbors.KNeighborsClassifier(k)
    scores=cross_val_score(knn,X,y,cv=10,scoring='accuracy')
    k_scores.append(scores.mean())
In [10]:
plt.plot(k_range, k_scores)
plt.xlabel('Value of K for KNN')
plt.ylabel('Cross-validated accuracy')
plt.show()
2.Weight를 준 KNN
In [11]:
n_neighbors = 40

h = .02  # step size in the mesh

cmap_light = ListedColormap(['#FFAAAA', '#AAFFAA', '#AAAAFF'])
cmap_bold = ListedColormap(['#FF0000', '#00FF00', '#0000FF'])

for weights in ['uniform', 'distance']:
    clf = neighbors.KNeighborsClassifier(n_neighbors, weights=weights)
    clf.fit(X, y)

    # Plot the decision boundary. For that, we will assign a color to each
    # point in the mesh [x_min, x_max]x[y_min, y_max].
    x_min, x_max = X[:, 0].min() - 1, X[:, 0].max() + 1
    y_min, y_max = X[:, 1].min() - 1, X[:, 1].max() + 1
    xx, yy = np.meshgrid(np.arange(x_min, x_max, h),
                         np.arange(y_min, y_max, h))
    Z = clf.predict(np.c_[xx.ravel(), yy.ravel()])

    # Put the result into a color plot
    Z = Z.reshape(xx.shape)
    plt.figure()
    plt.pcolormesh(xx, yy, Z, cmap=cmap_light)

    # Plot also the training points
    plt.scatter(X[:, 0], X[:, 1], c=y, cmap=cmap_bold,
                edgecolor='k', s=20)
    plt.xlim(xx.min(), xx.max())
    plt.ylim(yy.min(), yy.max())
    plt.title("3-Class classification (k = %i, weights = '%s')"
              % (n_neighbors, weights))

plt.show()
<ipython-input-11-9aab6fb5c0c0>:23: MatplotlibDeprecationWarning: shading='flat' when X and Y have the same dimensions as C is deprecated since 3.3. Either specify the corners of the quadrilaterals with X and Y, or pass shading='auto', 'nearest' or 'gouraud', or set rcParams['pcolor.shading']. This will become an error two minor releases later.
plt.pcolormesh(xx, yy, Z, cmap=cmap_light)
In [12]:
np.random.seed(0)
X = np.sort(5 * np.random.rand(40, 1), axis=0)
T = np.linspace(0, 5, 500)[:, np.newaxis]
y = np.sin(X).ravel()
y[::5] += 1 * (0.5 - np.random.rand(8))
In [13]:
knn = neighbors.KNeighborsRegressor(n_neighbors)
y_ = knn.fit(X, y).predict(T)
In [14]:
n_neighbors = 5

for i, weights in enumerate(['uniform', 'distance']):
    knn = neighbors.KNeighborsRegressor(n_neighbors, weights=weights)
    y_ = knn.fit(X, y).predict(T)

    plt.subplot(2, 1, i + 1)
    plt.scatter(X, y, c='k', label='data')
    plt.plot(T, y_, c='g', label='prediction')
    plt.axis('tight')
    plt.legend()
    plt.title("KNeighborsRegressor (k = %i, weights = '%s')" % (n_neighbors,
                                                                weights))

plt.tight_layout()
plt.show()
In [15]:
from IPython.core.display import display, HTML
display(HTML("<style>.container {width:80% !important;}</style>"))
728x90
'Data scientist > Machine Learning' 카테고리의 다른 글
| SVM + Python_Code (0) | 2021.08.26 |
|---|---|
| LDA + Python_Code (0) | 2021.08.25 |
| Naive Bayes + Python_Code (0) | 2021.08.25 |
| PCA + Python_Code (0) | 2021.08.23 |
| 회귀분석(4)_로지스틱 회귀분석 (0) | 2021.08.21 |


