#wannabeeeeeee the best DataScientist
LDA + Python_Code 본문
728x90
◎ 수학적 개념 이해


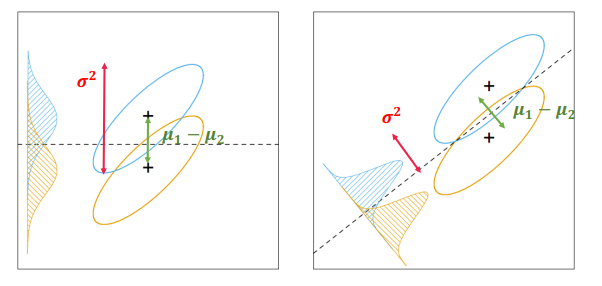
◎ Linear Discriminant Analysis(LDA)

※ LDA 결과 얻게 되는 decision boundary의 특징 : 평균의 차이는 최대화, 두 분포의 각각의 분산은 최소화


◎ LDA의 심화적 이해
- LDA decision boundary는 분산대비 평균의 차이를 극대화 하는 boundary
- 장점1 : Naive bayes 모델과 달리, 설명변수간의 공분산 구조를 반영
- 장점2 : 가정이 위반되더라도 비교적 robust
- 단점1 : 가장 작은 그룹의 샘플 수가 설명변수의 개수보다 많아야 함
- 단점2 : 정규분포 가정에 크게 벗어나는 경우 잘 설명하지 못함
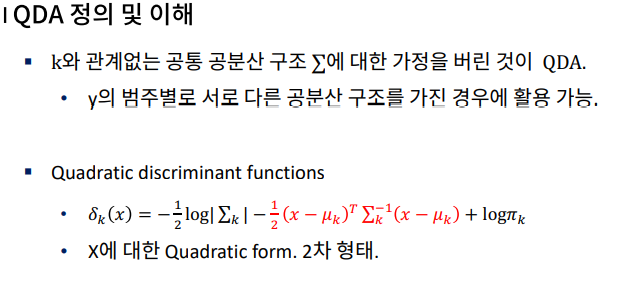
- 단점3 : y범주 사이에 공분산 구조가 다른 경우를 반영하지 못함


Linear Discriminant Analysis 실습
1. Linear Discriminant Analysis
In [1]:
import numpy as np
- LDA 를 위한 함수 불러오기
In [2]:
from sklearn.discriminant_analysis import LinearDiscriminantAnalysis
In [3]:
X = np.array([[-1, -1], [-2, -1], [-3, -2], [1, 1], [2, 1], [3, 2]])
y = np.array([1, 1, 1, 2, 2, 2])
- LDA 모델 구축
In [4]:
clf=LinearDiscriminantAnalysis()
clf.fit(X,y)
Out[4]:
LinearDiscriminantAnalysis()In [5]:
print(clf.predict([[-0.8, -1]]))
[1]
2. Quadratic Discriminant Analysis
- QDA를 위한 함수 불러오기
In [6]:
from sklearn.discriminant_analysis import QuadraticDiscriminantAnalysis
- QDA 모델 구축
In [7]:
clf2=QuadraticDiscriminantAnalysis()
clf2.fit(X,y)
Out[7]:
QuadraticDiscriminantAnalysis()In [8]:
print(clf2.predict([[-0.8, -1]]))
[1]
- LDA, QDA 비교
In [9]:
from sklearn.metrics import confusion_matrix
y_pred=clf.predict(X)
confusion_matrix(y,y_pred)
Out[9]:
array([[3, 0],
       [0, 3]], dtype=int64)
In [10]:
y_pred2=clf2.predict(X)
confusion_matrix(y,y_pred2)
Out[10]:
array([[3, 0],
       [0, 3]], dtype=int64)
3. LDA, QDA의 시각적 비교
In [12]:
from sklearn.datasets import make_moons, make_circles, make_classification
from matplotlib.colors import ListedColormap
from sklearn.model_selection import train_test_split
from sklearn.preprocessing import StandardScaler
import matplotlib.pyplot as plt
In [13]:
h=0.2
names = ["LDA", "QDA"]
classifiers = [
    LinearDiscriminantAnalysis(),
    QuadraticDiscriminantAnalysis()]

X, y = make_classification(n_features=2, n_redundant=0, n_informative=2,
                           random_state=1, n_clusters_per_class=1)
rng = np.random.RandomState(2)
X += 2 * rng.uniform(size=X.shape)
linearly_separable = (X, y)

datasets = [make_moons(noise=0.3, random_state=0),
            make_circles(noise=0.2, factor=0.5, random_state=1),
            linearly_separable
            ]

figure = plt.figure(figsize=(27, 9))
i = 1
# iterate over datasets
for ds in datasets:
    # preprocess dataset, split into training and test part
    X, y = ds
    X = StandardScaler().fit_transform(X)
    X_train, X_test, y_train, y_test = train_test_split(X, y, test_size=.4)

    x_min, x_max = X[:, 0].min() - .5, X[:, 0].max() + .5
    y_min, y_max = X[:, 1].min() - .5, X[:, 1].max() + .5
    xx, yy = np.meshgrid(np.arange(x_min, x_max, h),
                         np.arange(y_min, y_max, h))

    # just plot the dataset first
    cm = plt.cm.RdBu
    cm_bright = ListedColormap(['#FF0000', '#0000FF'])
    ax = plt.subplot(len(datasets), len(classifiers) + 1, i)
    # Plot the training points
    ax.scatter(X_train[:, 0], X_train[:, 1], c=y_train, cmap=cm_bright)
    # and testing points
    ax.scatter(X_test[:, 0], X_test[:, 1], c=y_test, cmap=cm_bright, alpha=0.6)
    ax.set_xlim(xx.min(), xx.max())
    ax.set_ylim(yy.min(), yy.max())
    ax.set_xticks(())
    ax.set_yticks(())
    i += 1

    # iterate over classifiers
    for name, clf in zip(names, classifiers):
        ax = plt.subplot(len(datasets), len(classifiers) + 1, i)
        clf.fit(X_train, y_train)
        score = clf.score(X_test, y_test)

        # Plot the decision boundary. For that, we will assign a color to each
        # point in the mesh [x_min, m_max]x[y_min, y_max].
        if hasattr(clf, "decision_function"):
            Z = clf.decision_function(np.c_[xx.ravel(), yy.ravel()])
        else:
            Z = clf.predict_proba(np.c_[xx.ravel(), yy.ravel()])[:, 1]

        # Put the result into a color plot
        Z = Z.reshape(xx.shape)
        ax.contourf(xx, yy, Z, cmap=cm, alpha=.8)

        # Plot also the training points
        ax.scatter(X_train[:, 0], X_train[:, 1], c=y_train, cmap=cm_bright)
        # and testing points
        ax.scatter(X_test[:, 0], X_test[:, 1], c=y_test, cmap=cm_bright,
                   alpha=0.6)

        ax.set_xlim(xx.min(), xx.max())
        ax.set_ylim(yy.min(), yy.max())
        ax.set_xticks(())
        ax.set_yticks(())
        ax.set_title(name)
        ax.text(xx.max() - .3, yy.min() + .3, ('%.2f' % score).lstrip('0'),
                size=15, horizontalalignment='right')
        i += 1

figure.subplots_adjust(left=.02, right=.98)
plt.show()
In [14]:
from IPython.core.display import display, HTML
display(HTML("<style>.container {width:80% !important;}</style>"))
728x90
'Data scientist > Machine Learning' 카테고리의 다른 글
| 의사결정나무 + Python_Code (0) | 2021.08.26 |
|---|---|
| SVM + Python_Code (0) | 2021.08.26 |
| K-NN + Python_Code (0) | 2021.08.25 |
| Naive Bayes + Python_Code (0) | 2021.08.25 |
| PCA + Python_Code (0) | 2021.08.23 |


